Summary of https://www.quantmetry.com/blog/topological-data-analysis-with-mapper/:
The Mapper algorithm was introduced by Singh, Memoli and Carlsson in Topological Methods for the Analysis of High Dimensional Data Sets and 3D Object Recognition (2007). It is used to
- visualize higher-dimensional data through a particular lens
- detect clusters and topological structure
- select features
The Algorithm
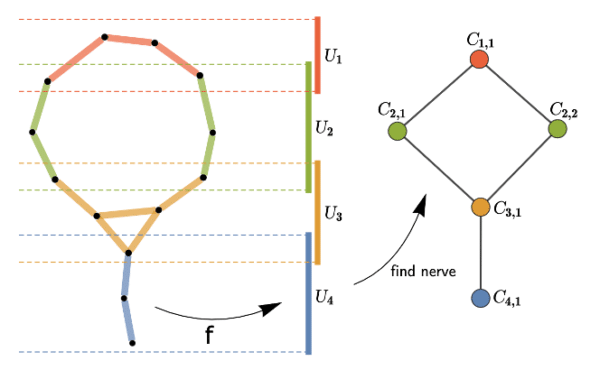
Given a dataset, we construct a simplicial complex by the following steps:
- Project the data to a lower-dimensional space via a filter function called a lens. Typically onto an axis.
- Construct a cover of the projected space.
- For each ball , cluster the points in the preimage .
- Take the nerve of the clusters, i.e., each cluster becomes a vertex and are connected via an edge if their clusters intersect, if three clusters intersect, connect via triangle, etc.
Lenses, coverings and clustering
The construction depends heavily on the lens . The choice of lens depends on the type of dataset and your goals. In the example above we are doing a simple height function. In biological applications, a distance to first -nearest neighbors is often used.
The construction also depends on the cover. A standard choice is a collection of -dimensional intervals as seen in the example above.
Mapper’s strengths
A common issue with dimensionality reduction algorithms is “projection loss”, that is, points may be far apart in high-dimension but nearby after projected to lower-dimension. Mapper corrects this issue by clustering the pullback of the cover.
Mapper allows us to visualize the topological structure of the higher-dimensional data with a graph representation.
Mapper helps select features that best discriminate data. We can explore the graph and see why the data is interconnected. We can also color the graph by some quantity we are interested in.
We can use Mapper to explore the data structure and gain new insights allowing us to improve some predictive model.