Data Sets
The full data set was created by combining two different data sets: actively collected (9355 individuals) and passively collected (3046 individuals). Columns that only appeared in one data set were added to the other data set then filled with blank entries.
There was an overlap in the values of Serial_No between the two data sets. To remain the values being unique, we add 1,000,000 to each serial in the passive data set. This also allows us to differentiate which data set the individual came from.
The following columns were removed:
- Name_of_the_study_participant
- Date_of_the_interview
- Tube_No_Spot_Fresh_sputum_sample_without_fixative
- Date_Collection_Spot_Fresh_sputum_sample_without_fixative
- Date_sent_to_Lab_Spot_Fresh_sputum_sample_without_fixative
- Date_Collection_Overnight_Fresh_sputum_sample_without_fixative
- Date_sent_to_Lab_Overnight_Fresh_sputum_sample_without_fixative
- Tube_No_Spot_Fresh_sputum_sample_with_preservative
- Date_Collection_Spot_Fresh_sputum_sample_with_preservative
- Date_sent_to_Lab_Spot_Fresh_sputum_sample_with_preser
- Tube_No_Spot_sputum_sample_with_Ethanol_Sol
- Date_Collection_Spot_sputum_sample_with_Ethanol_Soln
- Date_sent_to_Lab_Spot_sputum_sample_with_Ethanol_Soln
- Tube_No_Overnight_Stool_sample
- Date_Collection_of_Overnight_stool_sample
- Date_Sent_to_lab_of_Overnight_stool_sample
- Tube_No_Spot_Whole_Blood_sample
- Date_Collection_Spot_whole_blood_sample
- Scrutinize_Filled_all_questions
- Scrutinize_Sputum_collected
- Scrutinize_Stool_collected
- Scrutinize_Blood_collected
- Field_Investigator_name
- Date_checked_Field_investigator
- Checked_by_name
- Checked_by
- Designation
Statistical Analysis: Continuous Variables
We start by investigating for significant differences in the age, weight and height of individuals who tested ELISA positive/negative. A common approach is to use a two-sample t-test, which determines if there is a statistical difference between the means of two samples.
Running the t-test on these columns results in the following table:
| Age | Height (cm) | Weight (kg) | |
|---|---|---|---|
| Positive Mean | 32.0184 | 149.043 | 44.2147 |
| Negative Mean | 35.9002 | 149.262 | 46.8544 |
| t-stat | -3.13453 | -0.220966 | -2.74948 |
| p-value | 0.00172535 | 0.825122 | 0.00597772 |
The -value represents the probability of receiving the two samples under the assumption that they are independent. Using the golden standard of <0.05, we see that the average age and average weight of ELISA positive individuals is significantly lower than ELISA negative individuals.
Statistical Analysis: Categorical Variables
The majority of the data set is categorical, e.g. sex, marital status, religion, etc. For categorical data, we cannot use a t-test. Instead, we use another common test, the chi-squared two sample test. The chi-squared test provides a -value measuring the significance in the differences between the proportions of responses between two groups.
For example, consider the responses in regards to marital status:
| Positive | Negative | |
|---|---|---|
| Married | 305 | 11574 |
| Unmarried | 21 | 430 |
Running a chi-squared test on this table results in a -value of 0.0103. The -value being less than 0.05 suggests that there is significant differences in the proportions of responses between ELISA positive and ELISA negative individuals. We can see this visually by creating bar-charts:
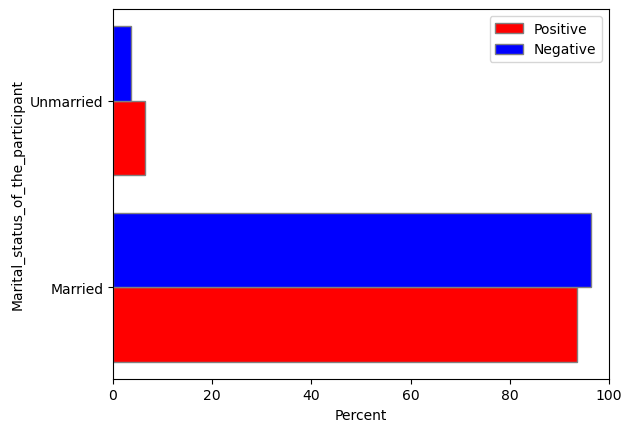
The red bars represent the percentage of ELISA positive individuals who gave a particular response. Likewise, the blue bars are the percentage of ELISA negative individuals who gave a particular response.
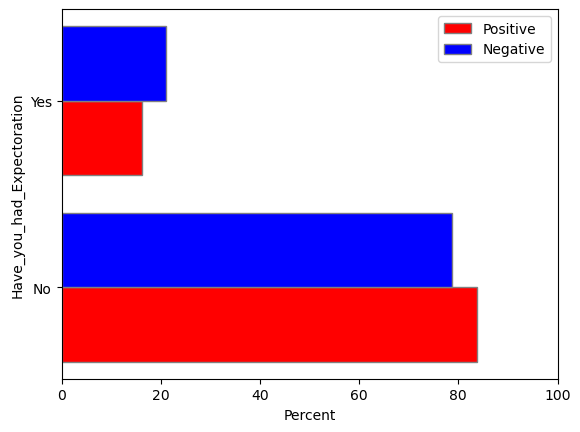
We get a similar result in terms of expectoration () and chest pain (:
| Positive | Negative | |
|---|---|---|
| Had Expectoration | 53 | 2540 |
| No Expectoration | 273 | 9461 |
| Positive | Negative | |
|---|---|---|
| Had Chest Pain | 51 | 2610 |
| No Chest Pain | 275 | 9391 |
Or in bar chart form:

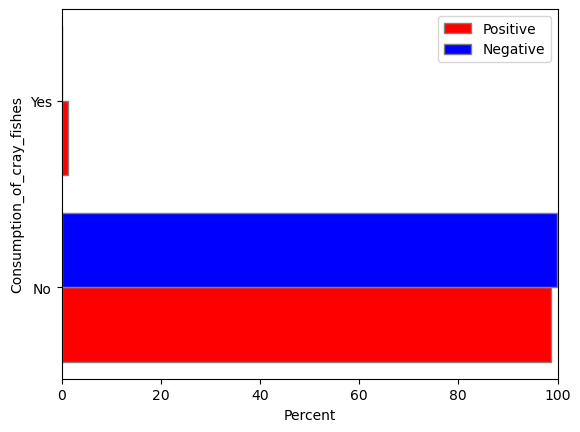
In terms of pathogen factors, we also find a strong significant difference in the consumption of cray fish ().
| Positive | Negative | |
|---|---|---|
| Consumes cray fish | 4 | 15 |
| Does not consume cray fish | 322 | 11989 |
In summary, we found statistically significant differences between ELISA positive and ELISA negative in the following variables:
- Marital status
- Expectoration
- Chest pain
- Consumption of cray fish
The remaining columns had no statistical significant differences. The breakdown of the remaining columns are included at the end of this document.
Future Work
There is a large difference in the sample sizes, 326 ELISA positive and 12075 ELISA negative. The chi-squared test is very sensitive to sample size which may result in false identification of statistically significant differences. More work needs to be done to take into account the large disparity between sample sizes.
Not all columns have been tested. For example, it may be beneficial to test the durations of symptoms with a t-test. Before doing so, some cleanup of the data is necessary as it is incomplete.
Full Breakdown
Host Factors:
Sex_of_the_study_participant p-value: 0.6600516932794341
| Positive | Negative | |
|---|---|---|
| Female | 180 | 6345 |
| Male | 146 | 5654 |
| Transgender | 0 | 5 |
Marital_status_of_the_participant p-value: 0.010338783754939688
| Positive | Negative | |
|---|---|---|
| Married | 305 | 11574 |
| Unmarried | 21 | 430 |
Religion_of_the_participant p-value: 0.8420839699727036
| Positive | Negative | |
|---|---|---|
| Chistianity | 0 | 5 |
| Hindu | 325 | 11941 |
| Islam | 1 | 58 |
Belongs_to_tribal_community p-value: 1.0
| Positive | Negative | |
|---|---|---|
| No | 326 | 12004 |
Educational_qualification_of_the_study_participant p-value: 0.1896305167122306
| Positive | Negative | |
|---|---|---|
| Graduate/Degree/Diploma | 74 | 2558 |
| Illiterate | 90 | 3004 |
| Post-graduate | 72 | 2439 |
| Secondary | 90 | 4003 |
Occupation_of_the_study_participant p-value: 0.07118126521529632
| Positive | Negative | |
|---|---|---|
| Agri. Laborer | 38 | 1222 |
| Construction laborer | 26 | 1050 |
| Forest products | 12 | 483 |
| Housewife | 1 | 42 |
| Livestock | 0 | 14 |
| MNREGA work only | 18 | 455 |
| Others | 1 | 13 |
| Own cultivation | 1 | 129 |
| Own cultivation and laborer | 70 | 1882 |
| Private | 2 | 63 |
| Small business/Petti/Tea shop | 30 | 986 |
| Student | 127 | 5665 |
Which_health_facility_do_you_access_when_you_are_sick p-value: 0.5154638395142579
| Positive | Negative | |
|---|---|---|
| Government | 300 | 10992 |
| Health centers run by NGO | 0 | 44 |
| Private | 25 | 841 |
| Self-treatment | 0 | 39 |
| Traditional healer | 1 | 88 |
Have_you_had_Cough p-value: 0.37789035913987745
| Positive | Negative | |
|---|---|---|
| No | 242 | 8556 |
| Yes | 84 | 3352 |
Have_you_had_Expectoration p-value: 0.037877357849456596
| Positive | Negative | |
|---|---|---|
| No | 273 | 9461 |
| Yes | 53 | 2540 |
Have_you_had_Chest_pain p-value: 0.010026969615090838
| Positive | Negative | |
|---|---|---|
| No | 275 | 9391 |
| Yes | 51 | 2610 |
Have_you_had_fever p-value: 1.0
| Positive | Negative | |
|---|---|---|
| No | 3 | 105 |
| Yes | 323 | 11896 |
Have_you_lost_appetite p-value: 0.15609852522410084
| Positive | Negative | |
|---|---|---|
| No | 300 | 10732 |
| Yes | 26 | 1269 |
Have_you_had_blood_in_sputum p-value: 0.430210821210259
| Positive | Negative | |
|---|---|---|
| No | 326 | 11947 |
| Yes | 0 | 54 |
Have_you_had_night_sweats p-value: 0.6305612868045478
| Positive | Negative | |
|---|---|---|
| No | 282 | 10248 |
| Yes | 44 | 1753 |
Have_you_lost_weight p-value: 1.0
| Positive | Negative | |
|---|---|---|
| No | 315 | 11595 |
| Yes | 10 | 386 |
Have_you_had_shortness_of_breath p-value: 0.22037504598491625
| Positive | Negative | |
|---|---|---|
| No | 267 | 9474 |
| Yes | 59 | 2527 |
Have_you_had_tiredness p-value: 0.8687320660144218
| Positive | Negative | |
|---|---|---|
| No | 252 | 9342 |
| Yes | 74 | 2659 |
Other_symptoms p-value: 1.0
| Positive | Negative | |
|---|---|---|
| No | 325 | 11951 |
| Yes | 1 | 50 |
Have_you_taken_any_treatment_or_actions p-value: 0.6159132422548381
| Positive | Negative | |
|---|---|---|
| No | 312 | 11597 |
| Yes | 0 | 38 |
Have_you_ever_been_treated_for_TB p-value: 0.6160488670397868
| Positive | Negative | |
|---|---|---|
| No | 312 | 11600 |
| Yes Currently on ATT | 0 | 38 |
Pathogen Factors:
Consumption_of_fresh_water_crabs p-value: 1.0
| Positive | Negative | |
|---|---|---|
| No | 0 | 5 |
| Yes | 326 | 11999 |
Duration_of_consumption_of_fresh_water_crabs p-value: 0.6758771337543388
| Positive | Negative | |
|---|---|---|
| 1-3 years | 0 | 3 |
| 3-11 months | 0 | 2 |
| <3 months | 0 | 51 |
| >5 years | 326 | 11948 |
Frequency_of_consumption_of_fresh_water_crabs p-value: 0.22952043999118324
| Positive | Negative | |
|---|---|---|
| More than once in a week | 18 | 511 |
| Occasionally | 37 | 1135 |
| Once in a month | 19 | 961 |
| Once in a week | 252 | 9397 |
Raw_fresh_water_crabs p-value: 1.0
| Positive | Negative | |
|---|---|---|
| No | 315 | 11585 |
| Yes | 11 | 419 |
Roasted_fresh_water_crabs p-value: 0.32006920638339187
| Positive | Negative | |
|---|---|---|
| No | 324 | 11980 |
| Yes | 2 | 24 |
Smoked_fresh_water_crabs p-value: 1.0
| Positive | Negative | |
|---|---|---|
| No | 326 | 12002 |
| Yes | 0 | 2 |
Soup_fresh_water_crabs p-value: 0.3020510534208001
| Positive | Negative | |
|---|---|---|
| No | 5 | 101 |
| Yes | 321 | 11903 |
Pickled_fresh_water_crabs p-value: 1.0
| Positive | Negative | |
|---|---|---|
| No | 326 | 12004 |
Cooked_fresh_water_crabs p-value: 1.0
| Positive | Negative | |
|---|---|---|
| No | 0 | 5 |
| Yes | 260 | 9231 |
Consumption_of_cray_fishes p-value: 1.78890200369268e-05
| Positive | Negative | |
|---|---|---|
| No | 322 | 11989 |
| Yes | 4 | 15 |
Duration_of_consumption_of_cray_fishes p-value: 1.0
| Positive | Negative | |
|---|---|---|
| 1-3 years | 3 | 15 |
Frequency_of_consumption_of_cray_fishes p-value: 1.0
| Positive | Negative | |
|---|---|---|
| Occasionally | 3 | 15 |
Raw_cray_fish p-value: 1.0
| Positive | Negative | |
|---|---|---|
| No | 326 | 12004 |
Roasted_cray_fish p-value: 1.0
| Positive | Negative | |
|---|---|---|
| No | 326 | 12004 |
Smoked_cray_fish p-value: 1.0
| Positive | Negative | |
|---|---|---|
| No | 326 | 12004 |
Soup_cray_fish p-value: 1.0
| Positive | Negative | |
|---|---|---|
| No | 325 | 11985 |
| Yes | 1 | 19 |
Pickled_cray_fish p-value: 1.0
| Positive | Negative | |
|---|---|---|
| No | 326 | 12004 |
Cooked_cray_fish p-value: 1.0
| Positive | Negative | |
|---|---|---|
| No | 326 | 12004 |
Consumption_of_wlid_boar_meat p-value: 0.06804177212239208
| Positive | Negative | |
|---|---|---|
| No | 323 | 11975 |
| Yes | 3 | 29 |
Duration_of_consumption_of_wild_boar_meat p-value: 0.9585895848817743
| Positive | Negative | |
|---|---|---|
| 1-3 years | 0 | 1 |
| 3-11 months | 0 | 1 |
| <3 months | 0 | 1 |
| >5 years | 3 | 29 |
Frequency_of_consumption_of_wild_boar_meat p-value: 1.0
| Positive | Negative | |
|---|---|---|
| Occasionally | 3 | 31 |
| Once in a month | 0 | 1 |
Raw_wild_boar_meat p-value: 1.0
| Positive | Negative | |
|---|---|---|
| No | 260 | 9236 |
Roasted_wild_boar_meat p-value: 1.0
| Positive | Negative | |
|---|---|---|
| No | 260 | 9236 |
Smoked_wild_boar_meat p-value: 1.0
| Positive | Negative | |
|---|---|---|
| No | 260 | 9236 |
Soup_wild_boar_meat p-value: 1.0
| Positive | Negative | |
|---|---|---|
| No | 260 | 9236 |
Pickled_wild_boar_meat p-value: 1.0
| Positive | Negative | |
|---|---|---|
| No | 260 | 9236 |
Cooked_wild_boar_meat p-value: 1.0
| Positive | Negative | |
|---|---|---|
| No | 260 | 9233 |
| Yes | 0 | 3 |
Consumption_of_Rodents_Rats_etc p-value: 1.0
| Positive | Negative | |
|---|---|---|
| No | 260 | 9236 |
Duration_of_consumption_of_rodents p-value: error
| Positive | Negative |
|---|
Frequency_of_consumption_of_rodents p-value: error
| Positive | Negative |
|---|
Raw_rodents p-value: 1.0
| Positive | Negative | |
|---|---|---|
| No | 260 | 9236 |
Roasted_rodents p-value: 1.0
| Positive | Negative | |
|---|---|---|
| No | 260 | 9236 |
Smoked_rodents p-value: 1.0
| Positive | Negative | |
|---|---|---|
| No | 260 | 9236 |
Soup_rodents p-value: 1.0
| Positive | Negative | |
|---|---|---|
| No | 260 | 9236 |
Pickled_rodents p-value: 1.0
| Positive | Negative | |
|---|---|---|
| No | 260 | 9236 |
Cooked_rodents p-value: 1.0
| Positive | Negative | |
|---|---|---|
| No | 260 | 9236 |