scikit-tda
Today I briefly went through the scikit-tda tutorial: https://docs.scikit-tda.org/en/latest/notebooks/scikit-tda%20Tutorial.html
VR Complex and Persistence Diagram
The Rips class from ripser module constructs a Vietoris-Rips filtration. The class provides a plot method which outputs a persistence diagram:
from ripser import Rips
rips = Rips()
dgm_noisy = rips.transform(data_noisy)
rips.plot(show=True, title="Noisy")
Rips class parameters (https://ripser.scikit-tda.org/en/latest/reference/stubs/ripser.Rips.html):
-
maxdim(int, optional, default 1) – Maximum homology dimension computed. Will compute all dimensions lower than and equal to this value. For 1, H_0 and H_1 will be computed. -
thresh(float, default infinity) – Maximum distances considered when constructing filtration. If infinity, compute the entire filtration. -
coeff(int prime, default 2) – Compute homology with coefficients in the prime field Z/pZ for p=coeff. -
do_cocycles(bool) – Indicator of whether to compute cocycles, if so, we compute and store cocycles in the cocycles_ dictionary Rips member variable -
n_perm(int) – The number of points to subsample in a “greedy permutation,” or a furthest point sampling of the points. These points will be used in lieu of the full point cloud for a faster computation, at the expense of some accuracy, which can be bounded as a maximum bottleneck distance to all diagrams on the original point set
The tutorial gives code for computing and plotting the VR complex of a data set:
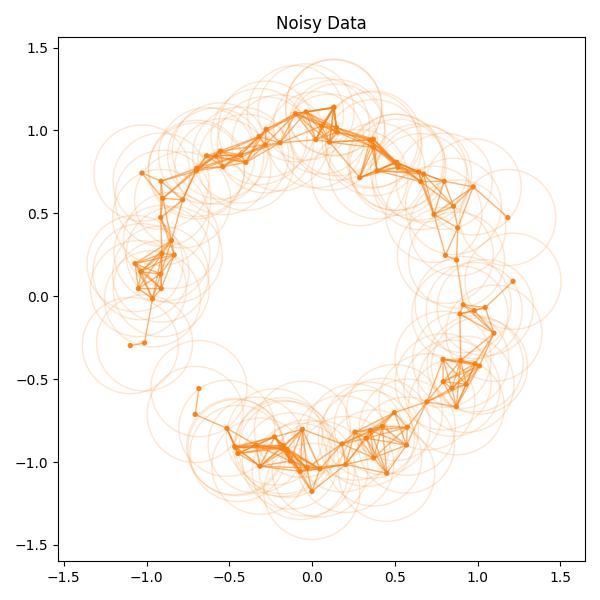
The function can be found in ~/src/py/scikit_tda_tut/plot_utils.py.