Persistent Homology: A Non-Mathy Introduction with Examples
Full article: https://towardsdatascience.com/persistent-homology-with-examples-1974d4b9c3d0
The focus of persistence homology can be summed up as
As one increases a threshold, at what scale do we observe changes in some representation of the data?
0d Persistent Homology
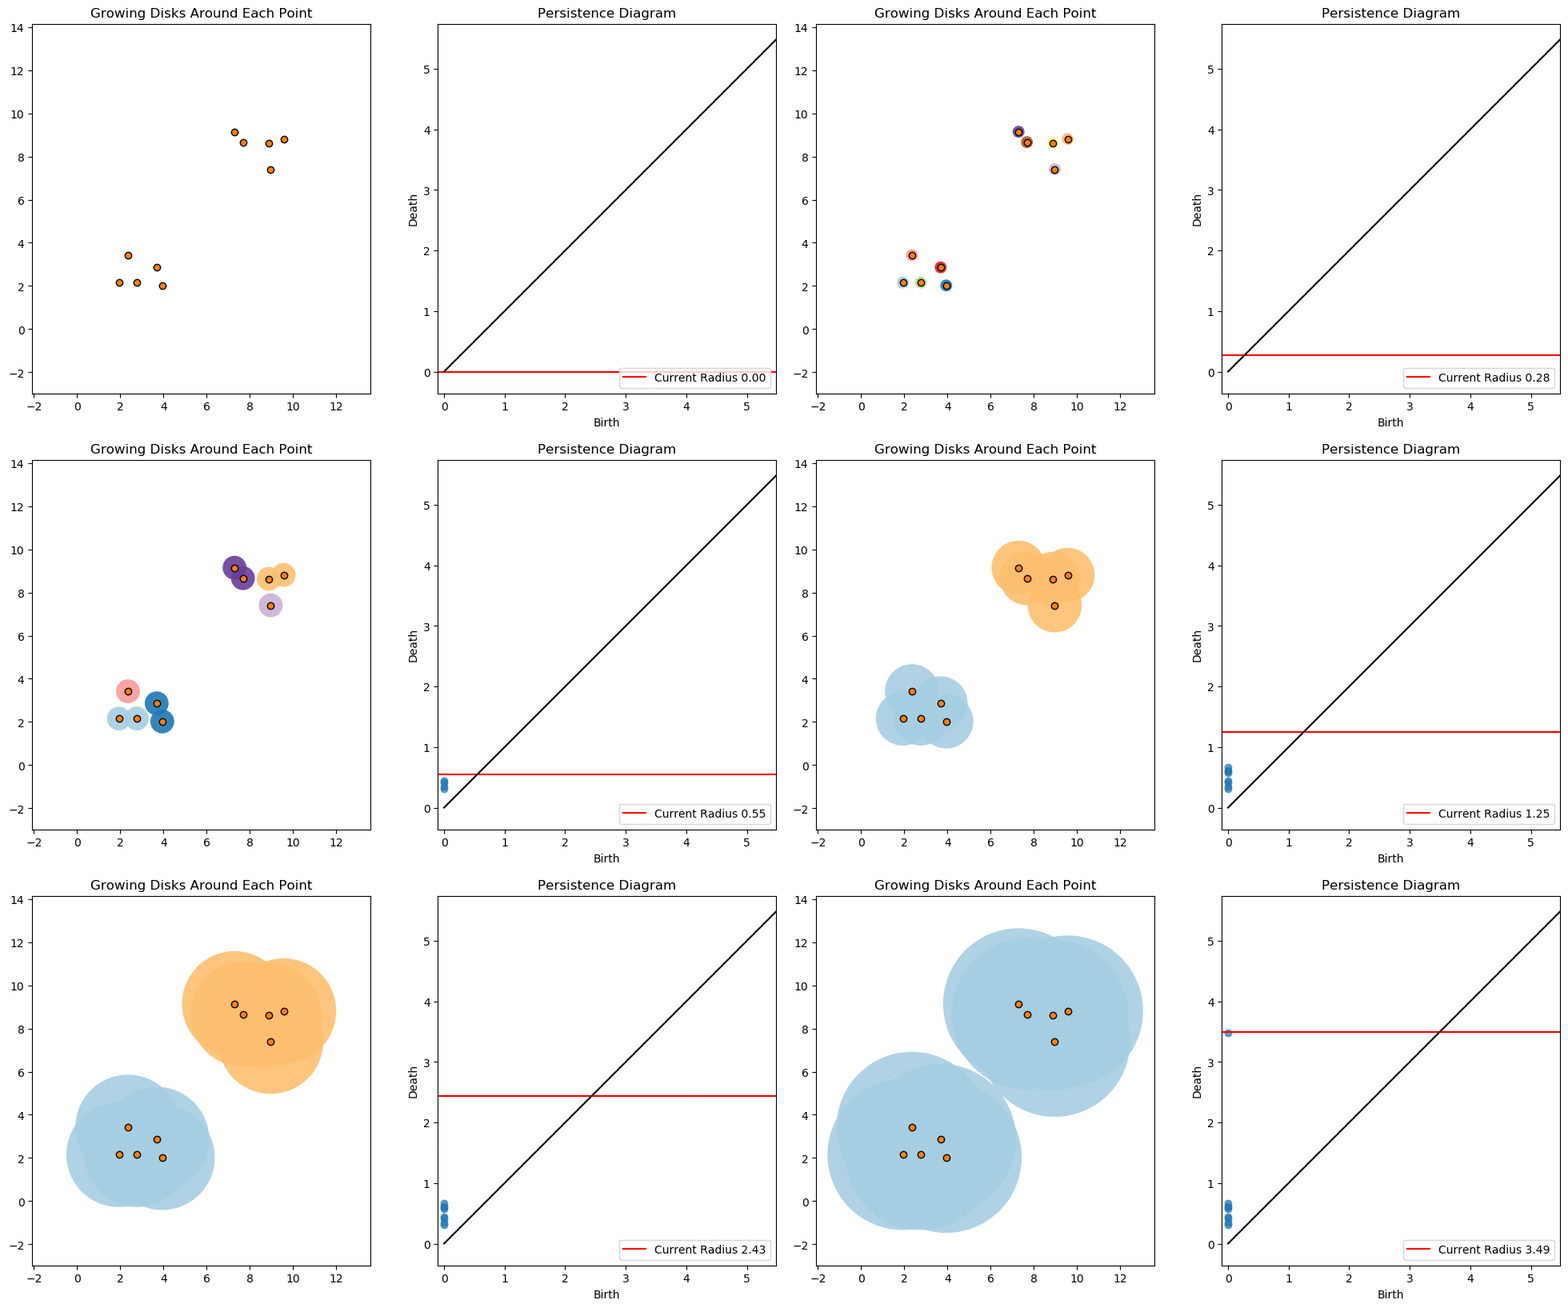
The key focus in 0-dimensional persistent homology is connected components. Take the Cech complex as an example as the radius increases. Once two balls begin to touch a new simplex is born.
Starting at , the number of connected components is equal to the number of points. As the radius increases more and more points are connected. As a result the number of connected components decreases. These decreases correspond to deaths of classes and are indicated by points in our persistence diagram.
Below is an animated example with each connected component represented with a different color.

There is a special significance to the gap between points in persistence diagrams. Initially the number of life-death pairs are clumped together due to the close proximity of points. Eventually all the close points have been connected and it take a much larger radius before we see any more connections.
1d Persistent Homology
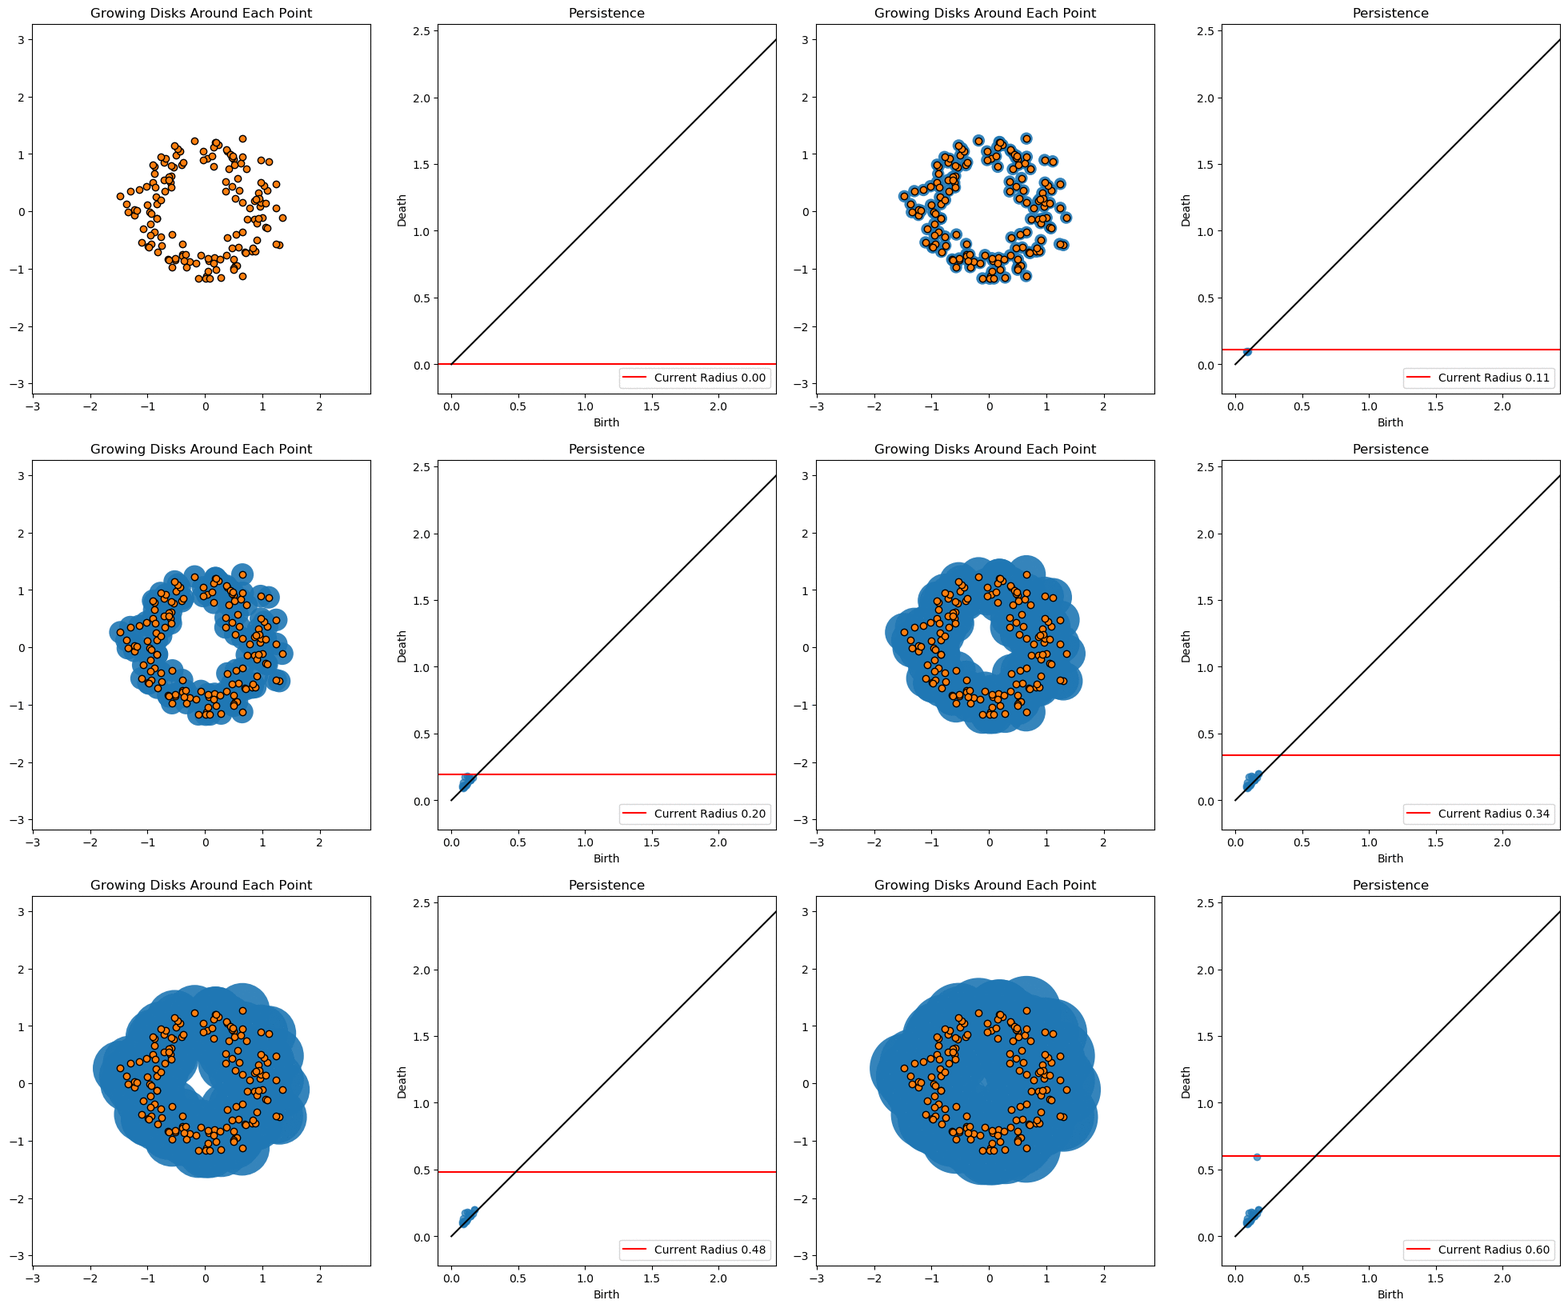
For 1-dimensional persistent homology we focus on the holes. As we increase the radius eventually an annulus is formed (around ) resulting in the birth of a hole. As the radius increases the annulus turns into a disk (around ) resulting in the death of the hole.

Notice that there is a bit of noise for small radii. This is the result of brief instances of holes forming and then subsequently dying.
These notions extend further with each dimension capturing a different dimensional class. As a recap from class:
- 0-dimensional: connected components
- 1-dimensional: holes
- 2-dimensional: enclosed spaces
Example: Signals
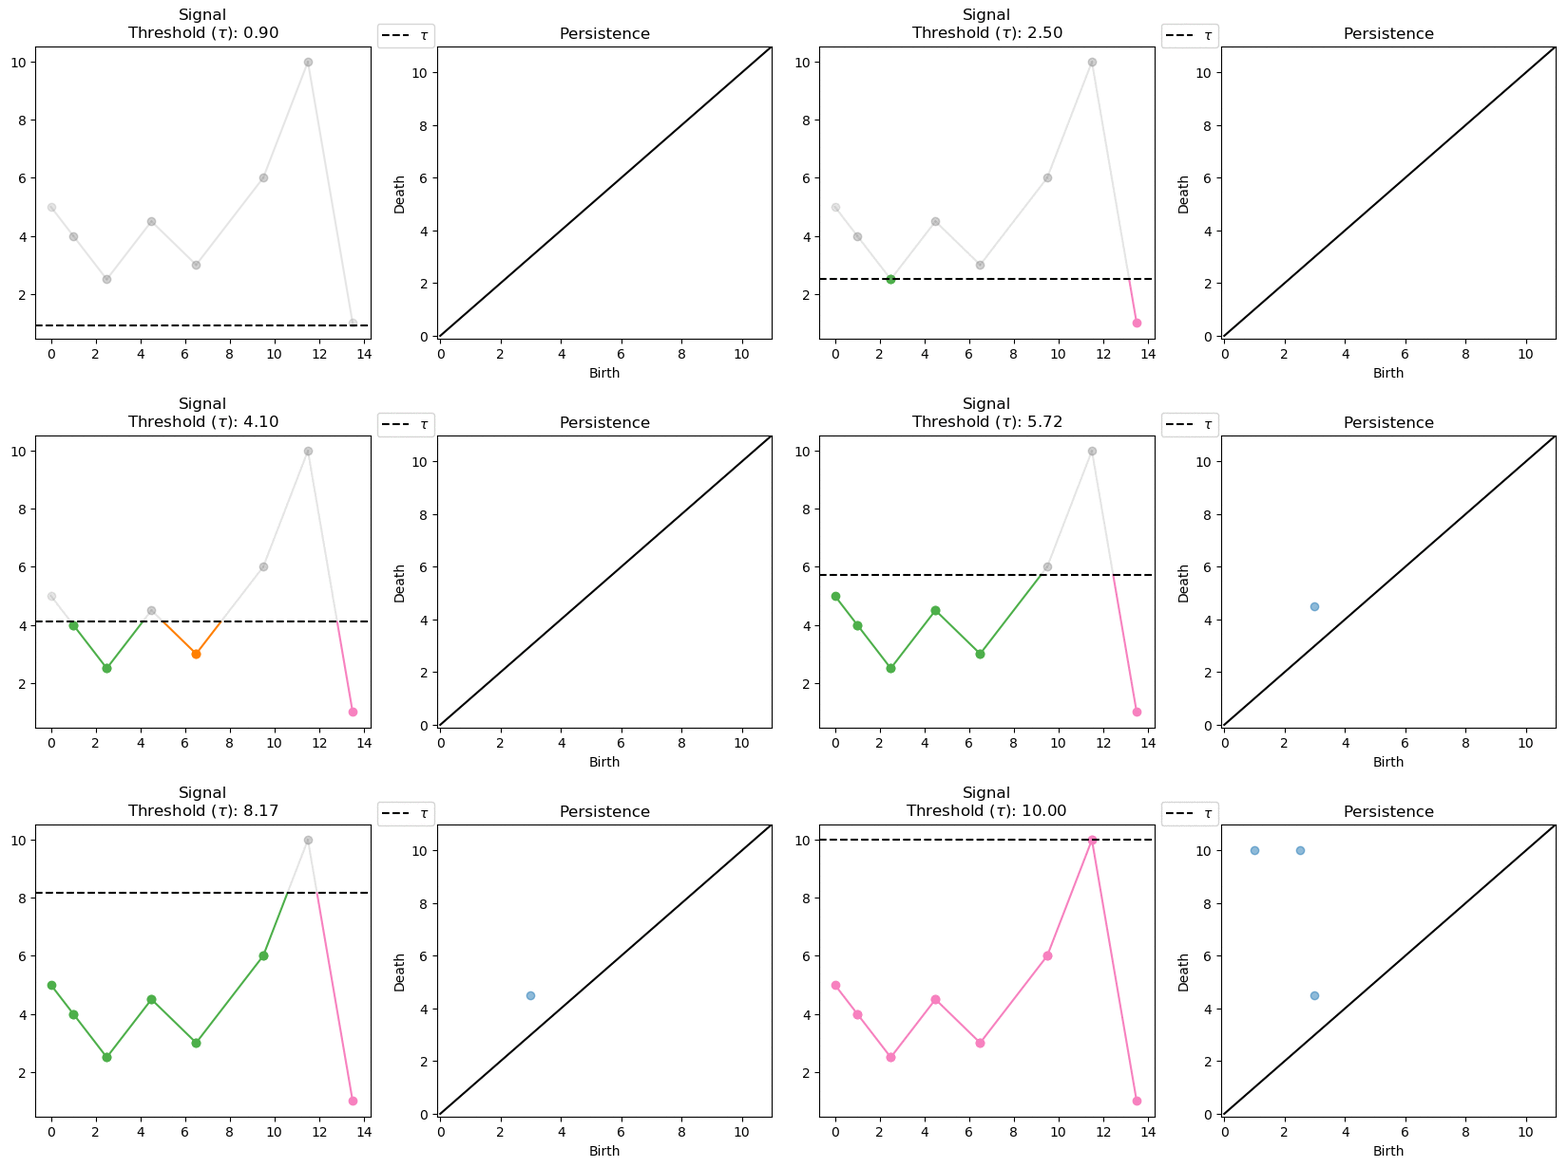
Instead of using the Cech complex, we track connected components of a signal by sweeping along the height.

As we increase the threshold the orange and green components meet up. Resulting in the death as two classes have merged together. Eventually the green and pink components also meet up, resulting in another death. This time we created a “point at infinity” to the oldest class (pink) that never dies. This is a common practice, although some authors simply ignore the points at infinity. We choose to keep it as it stores the global minimum and maximum of the signal.
A common problem with signals is compression. Instead of transmitting a large sample of data points, can we transmit a fraction of the data while still maintaining the information.
The persistent homology here keeps track of the signal’s critical points. From the persistence diagram we can reconstruct the underlying signal. We can remove a large number of points before distorting the signal too much. Even with as few as 50 points (95% compression) we get a decent representation of the signal.
