Changes Between Data Sets
Mahantesh sent us a modified copy of the paragonimiasis data sets. I loaded each merged data set (combination of passive and active studies) into pandas and spent some time comparing the differences between the data sets.
The following columns had their names corrected:
- Taenia_solium †
- Sputum_test
- Pinworms †
- Ascaris_Lumbricoides †
- Hymenolepis †
- Strongyloides_larvae †
- Other_tests
- Hookworms †
- Taenia_saginata †
- Mantoux_test
- X_Ray_test
- Trichuris_trichiura †
- Intestinal_trematodes †
All of the columns marked with † have the sole value of “No” for all patients. The remaining have at most 37 filled entries and 12,363 missing entries.
A single patient (ID of P2019) was removed in the new data set.
I then went through each column and counted the number of changed entries between the two data sets. It appears the column Serial_No has changed which I had been using an index. So instead we make comparison based on the unique patient identifier given by Individual_Particular_ID and make the assumption that these identifiers have not changed.
The code for detecting changes for a specific column is given below:
def detect_changes(col):
    count = 0
    for patient in shared_patients:
        try:
            new_value = df_new.loc[df_new['Individual_Particular_ID'] == patient, col].to_list()[0]
            old_value = df_old.loc[df_old['Individual_Particular_ID'] == patient, col].to_list()[0]
            if new_value != old_value and not np.isnan(new_value):
                count += 1
        except:
            pass

    return count
In summary, for each column that the two data sets share, we walk through each patient that are contained in both data sets. Then for each patient we check if their value for the current column has changed. We keep track of the number of changes per column. The resulting counts are given below:
| Column Name | # Changes |
|---|---|
| Age_of_the_study_participant | 1 |
| Weight_of_the_study_participant_in_Kgs | 1 |
| Height_of_the_study_participant_in_Cms | 6 |
Training Results
Below is training results of the original data set:
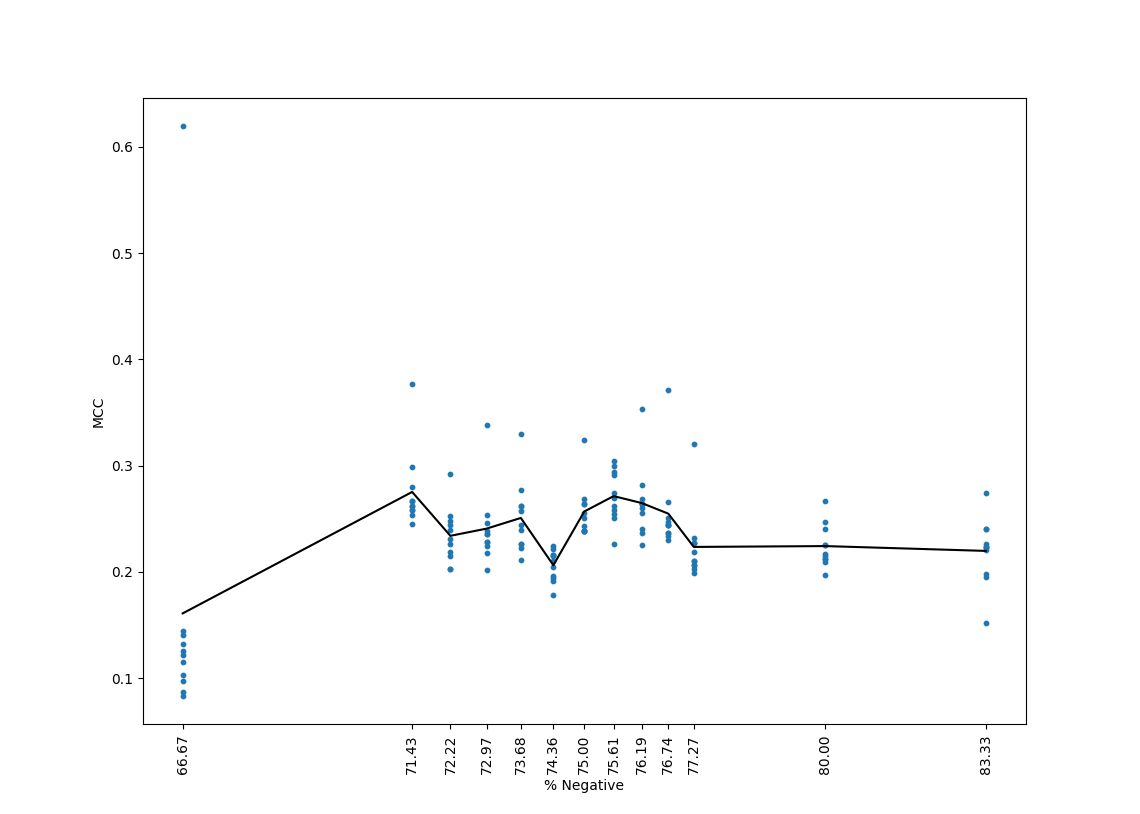
Below is the training results of the new data set:
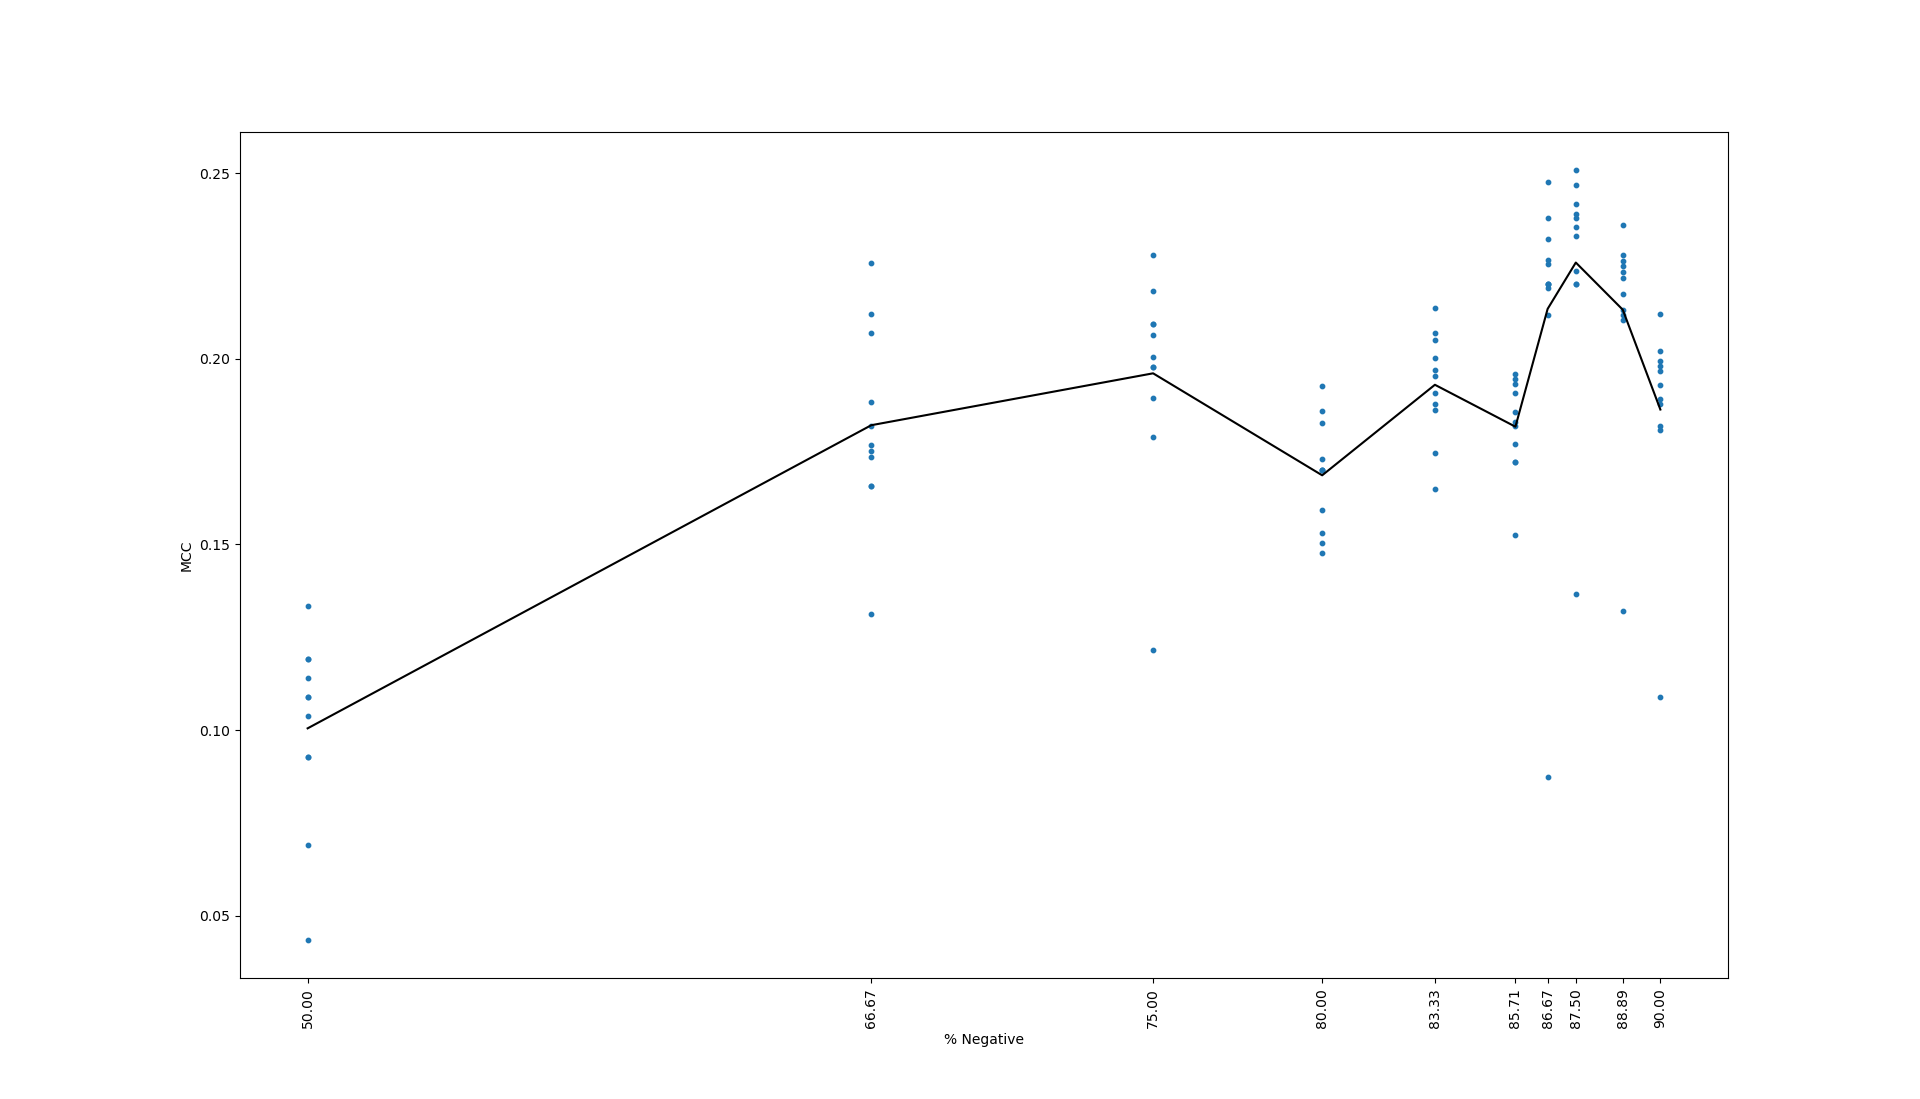
The black bar represents the mean MCC value across the eleven trials.